Introduction to Rasterio and Fiona with Worldpop data
(Post originally posted on steemit)
A while ago I shared a tutorial for using WorldPop raster data with R here. I don’t usually prefer R, but I have to use it when python does not have some statistical method. In this particular case, though, python turned out to be quite easy and nice to use than R. This is a small introduction to packages rasterio and fiona. Rasterio has been developed by mapbox, one of the best open source companies I’ve seen. They have released lots of free/open-source software of really good quality. This package allows to manipulate raster files (obviously). Fiona is a very nice OGR api for python, which is the most used open source software to handle GIS data . I introduced Worldpop project before, but I will mention here that it is a very cool scientific project that estimates demographics data with satellite images.
First we import the dependencies:
import rasterio
from rasterio import mask
import fiona
import matplotlib.pyplot as plt
import matplotlib as mlp
import numpy as np
import pandas as pd
import re
%matplotlib inline
Next we read the data. Rasterio offers a very transparent object:
wpgt_file = "../../Downloads/GTM-ppp/GTM_ppp_v2b_2015.tif"
wpgt_r = rasterio.open(wpgt_file)
wpgt_r.bounds
> BoundingBox(left=-92.24071231229665, bottom=13.738426751815744, right=-88.22087311229664, top=17.81909685181575)
wpgtd = wpgt_r.read(1)
wpgtd.shape
> (4897, 4824)
I notices that empty cells had a large negative value, which is actually wrong. They should contain None or NaN, from numpy. This messes with the visualization, so I replace those with -1
wpgtd[wpgtd<0] = -1
Now let’s plot the whole country:
plt.rcParams['figure.figsize'] = 14, 14
plt.imshow(np.log10(wpgtd+1), )
bar = plt.colorbar(fraction=0.03)
bar.set_ticks([0, 0.301, 1.041, 1.708, 2.0043])
bar.set_ticklabels([0, 1, 10, 50, 100])
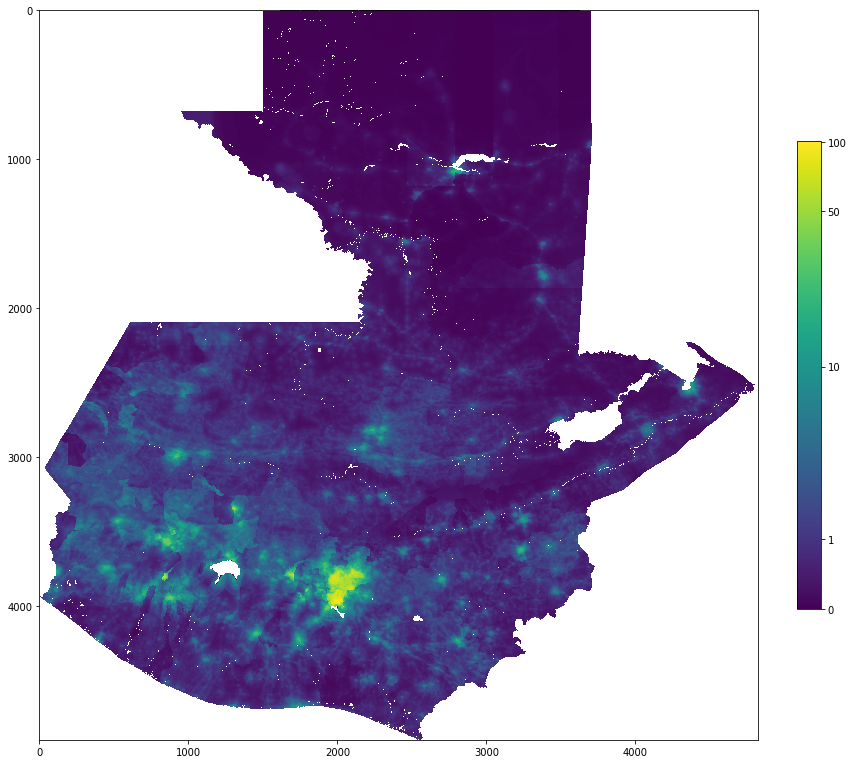
Default visualization is quite nice 🙂
Ok, now we get the geojson with the municipalities. This file can be found in the archive.
munis = fiona.open("./IGN-cartografia_basica-Division-politica-ADministrativa.georss.geojson")
attributes = {}
for i, muni in enumerate(munis):
    atrs = re.findall("span class\=\"atr-name\">([^\<]*).*span class\=\"atr-value\"\>([^\<]*)",
          muni["properties"]["description"], re.MULTILINE)
    attributes[i] = dict(atrs)
Municipalities are those with a depto attribute and non-zero cod_muni. Since this data includes two lakes and Belize (which is not part of Guatemala, but ignorant people keep reclaiming it as Guatemalan), we need to filter:
munis_ix = [i for i, x in attributes.items() if "COD_DEPT_1" in x and x["COD_MUNI_1"] != "0"]
Let’s plot Guatemala department:
gtdepto = [gt for gt in munis_ix if attributes[gt]["COD_DEPT_1"] == "01"]
gtraster, bound = mask.mask(wpgt_r, [munis[i]["geometry"] for i in gtdepto], crop=True)
plt.rcParams['figure.figsize'] = 14, 14
plt.imshow(np.log10(gtraster[0]+1), )
bar = plt.colorbar(fraction=0.03)
bar.set_ticks([0, 0.301, 1.041, 1.708, 2.0043])
bar.set_ticklabels([0, 1, 10, 50, 100])
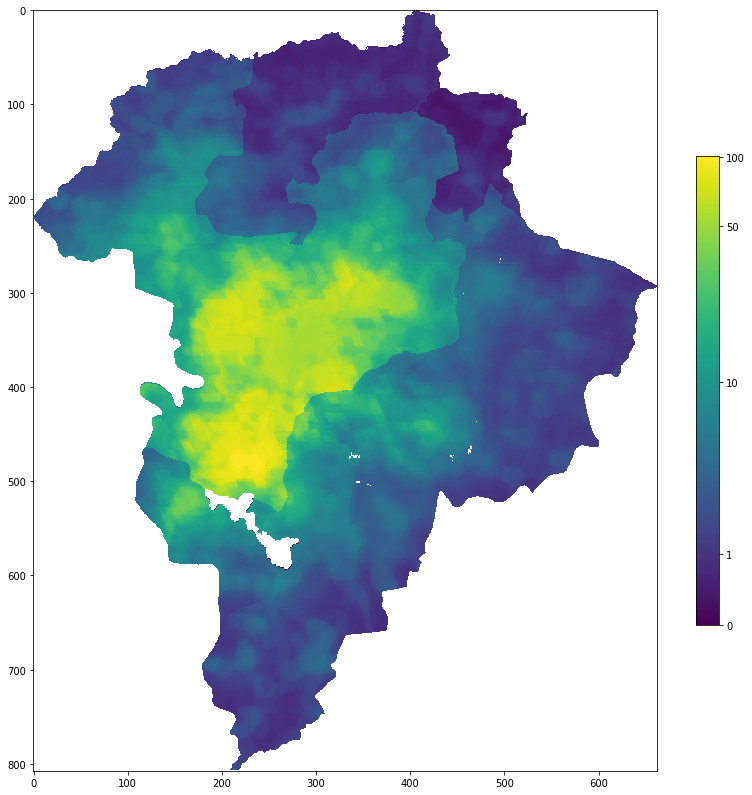
Now let’s just sum over the geometries to find out the estimated population for Guatemalan department:
gtraster[gtraster>0].sum()
3436118.8
And for the whole country:
wpgtd[wpgtd>0].sum()
15929699.0
As you can see, rasterio is very straightforward and easy to use. Fiona is also very nice and doesn’t get in the way. Most of the code is just lists manipulation which is quite nice, because these both packages work in a very intuitive way. I felt the python way of doing things was way nicer than R code for this same task, but that’s a matter of taste 🙂